You've Reached the Center of the Internet
It's a blog
Batting Order (Kind of) Doesn't Matter*
I live in Greater Boston, but I’ve been a Yankees fan my whole life. The season is getting started and I have a new baby, so I’ve been listening to every episode of my favorite baseball podcast, Talkin’ Yanks. Hosts Jomboy and Jake spend a lot of time discussing, critiquing, and guessing Yankees batting orders. It’s a fun topic, but my intuition is that the batting order isn’t that important. This post is my attempt at estimating how important batting order is.
Jomboy predicts the Yankees Opening Day starting lineup pic.twitter.com/PeeX2YKzjT
— Talkin' Yanks (@TalkinYanks) March 18, 2025
The method
I used a Monte Carlo approach to generate distributions of runs scored given different batting orders. This is a fancy way of saying that I simulated a lot of baseball games with different lineups, and used the outcomes of those simluations as distributions of expected run production. By comparing these distributions across different batting orders, I could evaluate which lineups are more effective.
To implement the simulation, I modeled the game in the simplest way I could. As you’ll see, I think it does a decent job of capturing reality. I defined hitters as a set of static per-plate-appearance probabilities. The plate appearance outcomes I modeled are walk, single, double, triple, and home run. So each hitter is completely defined by their \(P_{BB}\), \(P_{1B}\), \(P_{2B}\), \(P_{3B}\), and \(P_{HR}\).
To simulate a game, I step through the lineup and randomly select an outcome weighted by the current batter’s probabilities. I track outs and runs scored and which bases are occupied. When three outs are recorded, I clear the bases and start the next inning. To simulate a game, I run this algorithm for 9 innings and track what happens.
I use simple logic to advance baserunners and score runs.
- Walks advance runners only when forced
- Singles put the batter on first and score runners from second and third
- Runners advance from first to third with 30% probability, else they go to second base
- Doubles clear the bases and put the batter on second
- Triples clear the bases and put the batter on third
- Home runs clear the bases and score the batter
- Outs advance runners from second to third and score runners from third with 10% probability
By running hundreds of thousands of such simulations I can estimate distributions of team outcomes.
There’s a lot here that’s not modeled. The pitcher is of course an important factor, but my model essentially always assumes an average pitcher is on the mound. Similarly, factors like the defense, runners, lefty/righty splits, extra innings, and emotion, are not modeled.
With that caveat, here is the simulated distribution of the runs scored in each game by the 2024 Yankees. I’ll focus on the Ya
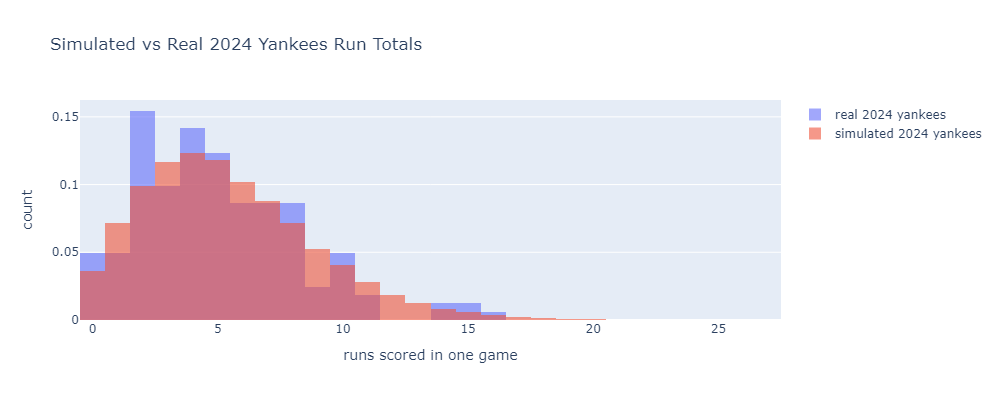
I used 2024 data from Baseball Reference to define the plate appearance outcome probabilities for a lineup of Gleyber Torres, Juan Soto, Aaron Judge, Austin Wells, Giancarlo Stanton, Jazz Chisolm Jr., Anthony Rizzo, Anthony Volpe, and Alex Verdugo.
Alongside the simulation results, I plotted the actual per-game run distribution from the same year. The model lines well with the real data.
Before messing with batting orders, a sanity check. What happens if we remove Aaron Judge from this lineup? He’s the best hitter here by a decent margin, so it should have a big effect. Here’s what the run distribution looks like if you replace Judge with a second copy of leadoff hitter Gleyber Torres.
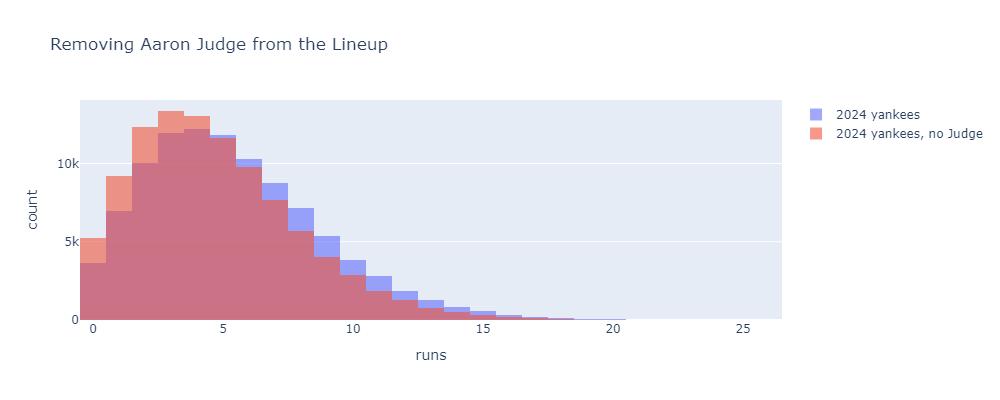
Pretty big effect. Replacing Judge with another Gleyber brings the 2024 Yankees from 5.4 to 4.7 runs per game. Incidentally, if you multiply this per-game difference by the number of games Judge played, subtract the total difference from the Yankees’ 2024 total runs scored, and plug into a Pythagorean win-loss formula, you get a value of about 10 Wins Above Gleyber or 11.7 Wins Above Replacement. This is pretty close to his 2024 fWAR of 11.2. Nice to see different methods agree.
The results
Now let’s get to batting order. Here’s what happens if we do something pretty extreme and slide Judge from 3rd in the lineup, where he typically hit in 2024, all the way down to 9th.
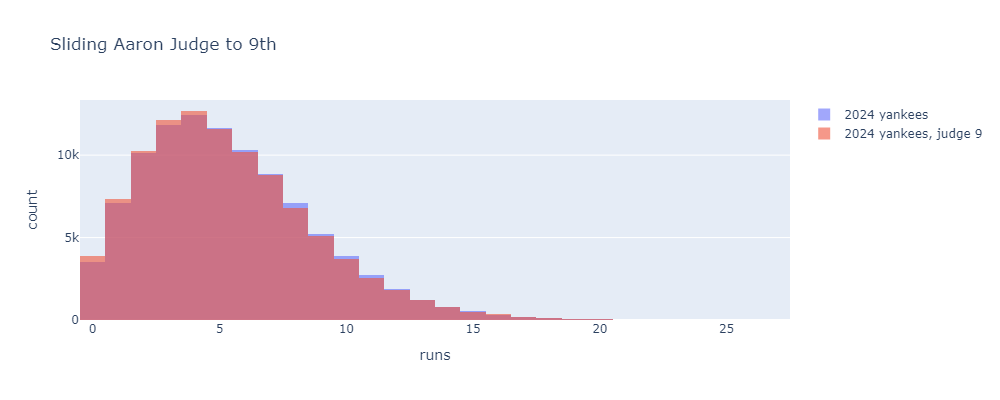
Much smaller change, but actually still significant. This change decreases the average runs scored from about 5.4 to 5.3 runs per game. This pencils out to about one Pythagorean win. One win is significant, but this is a drastic lineup move that no one would ever consider.
Here are the mean runs scored when placing Judge in each lineup position.
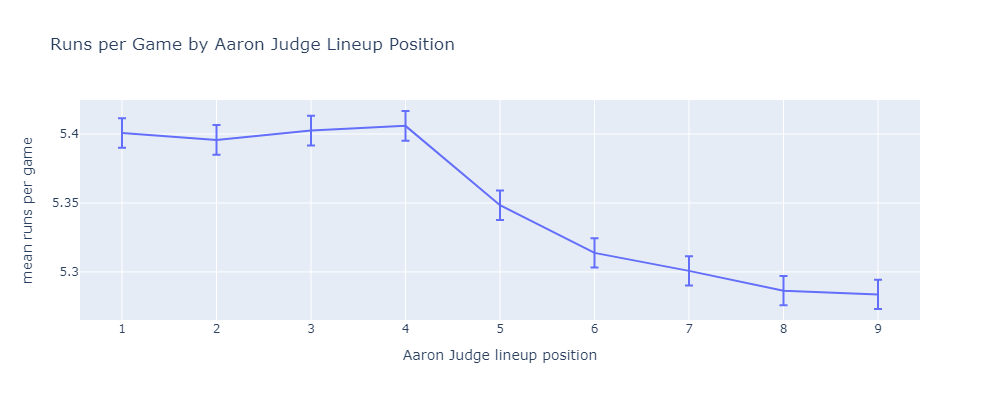
The first four positions are statistically indistinguishable. Once Judge reaches the bottom of the order, there is a real difference. Using this method, it’s easy to dig deeper into why the first four positions are meaningfully better.
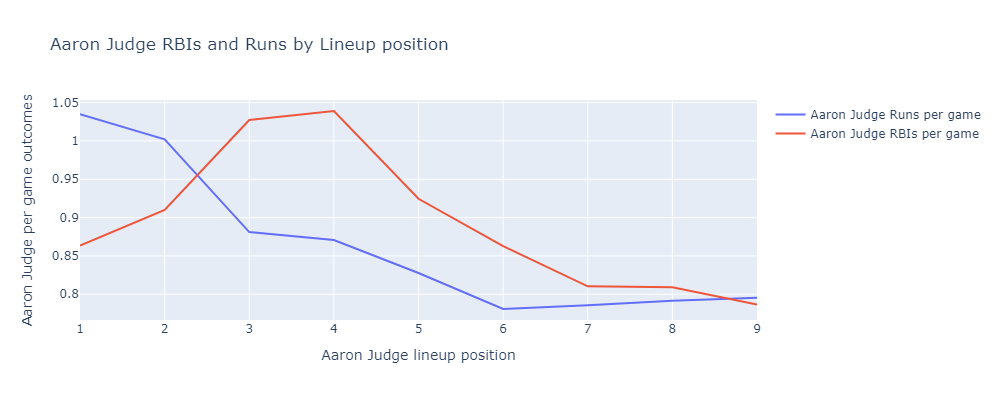
If Judge hits 1st or 2nd, he scores more runs. He hits more often, and gets driven in by Juan Soto a lot. If Judge hits 3rd or 4th, he drives in more runs. He drives in on-base machine Juan Soto a lot.
My conclusion
Overall, I think this means we shouldn’t worry too much about the lineup. Put the best hitters at the top and the worst hitters at the bottom. Don’t hit Aaron Judge ninth.
As I said above, lefty/righty matchups are not factored in here. I think it makes sense to try to alternate lefties and righties in the lineup to avoid giving relief pitchers runs of like-handed hitters to face. I would love to factor this into my model, but the adversarial nature of relief pitcher strategy makes it much more complicated than what I did above.
So alternate lefties and righties, put the best hitters at the top, and stop worrying.
Jake sucks (not really).
Update
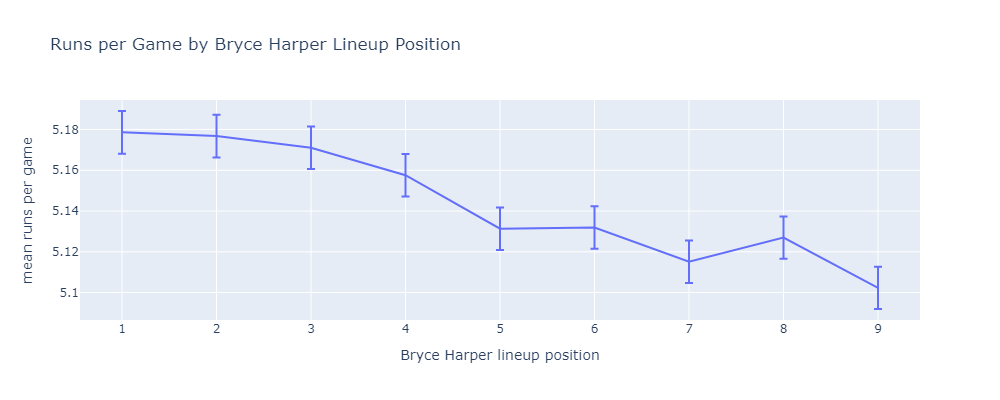
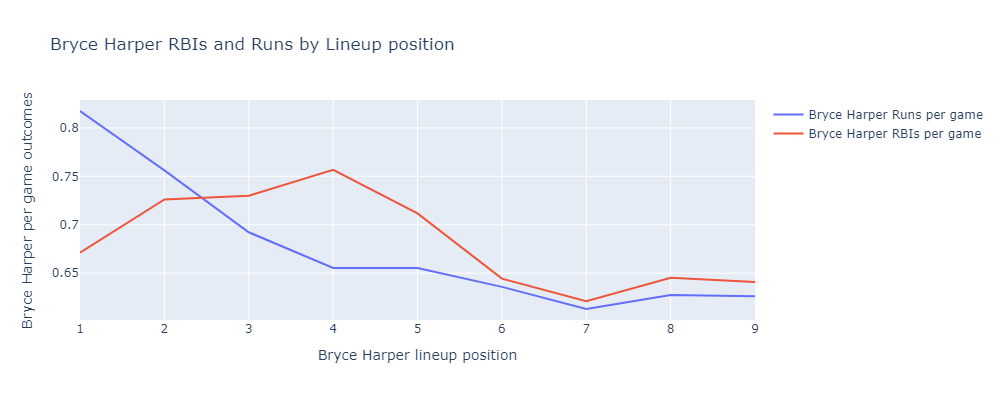
In response to Reddit commenters u/HyperactiveBaldMonk and u/BatJewOfficial, here are similar results for the Bryce Harper and the 2024 Phillies.
*if you ignore a bunch of things including relief pitcher lefty/righty matchup strategy