You've Reached the Center of the Internet
It's a blog
Expected Strike Difference -- A simple catcher framing metric
In this post I’ll build a simple catcher framing metric I’m calling Expected Strike Difference. The approach is similar to some other recent posts of mine like this one. Using pybaseball Statcast data I’ll train a classifier to predict whether a pitch will be called a ball or a strike based on the location where it crosses the plate, the count, handedness of the hitter. Then I’ll go through every pitch caught by each catcher and count up the differences between the predicted strikes and called strikes. This difference theoretically represents the number of extra strikes stolen (or lost) compared to an average catcher.
The Data
First the basics.
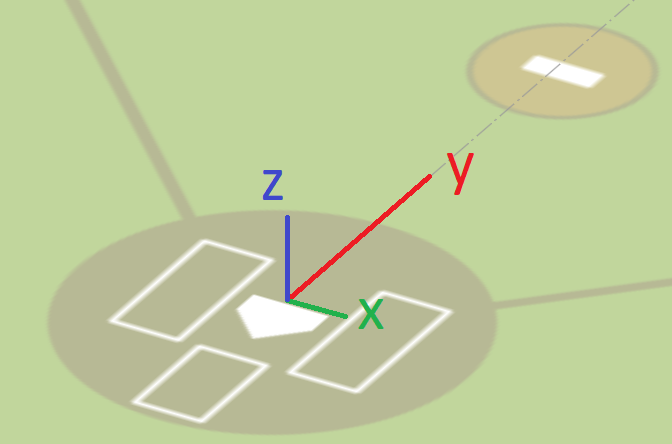
In the Statcast coordinate system, x is inside-outside in the strikezone with the first-base side positive, y is toward-away from the catcher with the field side positive, z is up-down with up positive.
Here’s what the observed strike zone looks like:
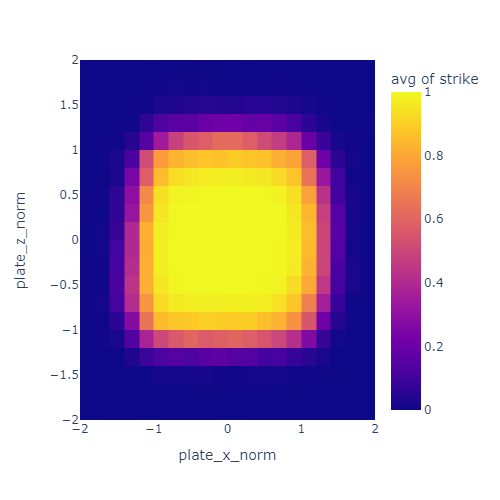
I normalized the pitch location such that the plate spans from -1 to 1 in each dimension. That’s what the “norm” means in the axis labels. The unit here is half plate-widths since -1 to 1 is a full width.
The color represents the probability of a pitch being called a strike based on location. The strikezone is a bit wider than the nominal 17 inches of the plate. Most of this is due to the width of the ball itself (about 3 inches or or 0.17 plate widths).
Next, here a few fun details I found and tried to account for.
Batter handedness
I noticed that the strikezone looks a bit different for left handed and right handed hitters. Specifically, it seems to be offset a little bit away from the hitter. I decided to correct for this by reversing the x direction of the strike zone for lefties.
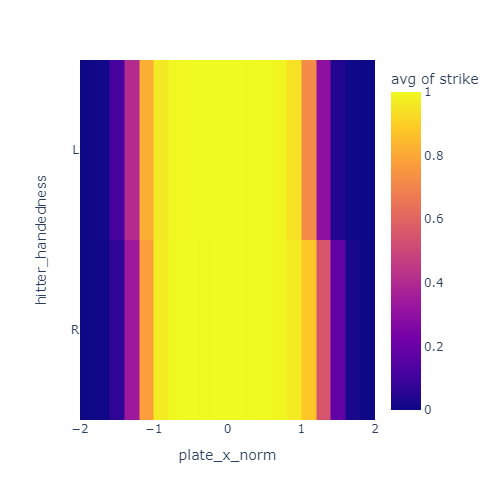
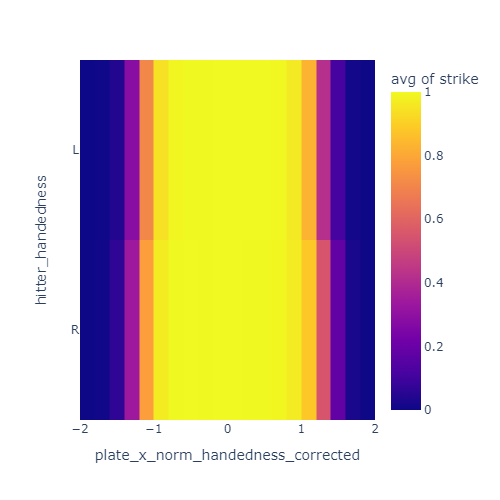
These plots show the just the x coordinate of the strike zone for lefties and righties. In the left plot, the yellow band is offset to the negative-x side for lefties compared to righties. After correcting for handedness by reversing x for lefties, this offset is mostly gone in the right plot.
Two strikes, three balls
I also noticed that umpires are less likely to call a marginal pitch a strike when there are two strikes. I’ve heard this called “omission bias” and it is a well documented effect in strike calling. Basically, umps are a bit adverse to calling strike three or ball four and directly ending the at-bat.
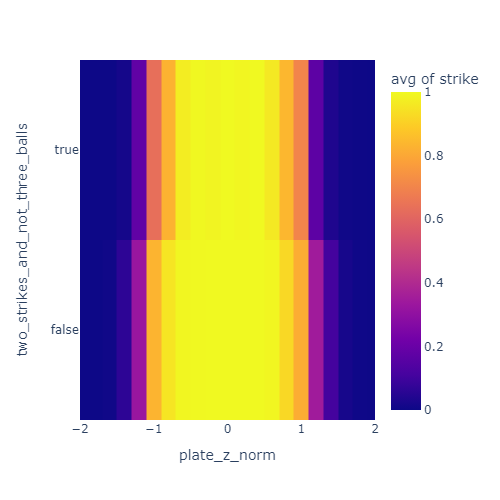
This plot shows a skinnier yellow band when there are two strikes and less than three balls. This indicates that the effective strike zone is smaller in that situation.
Similarly, they are less likely to call a ball with three balls and less than two strikes.
Pitch movement
My intuition was that the transverse velocity (the left-right and up-down velocity) of the pitch will have an influence on the umpire’s call. For example, I expected a pitch at the bottom of the zone to have a better chance of being called a ball if it is breaking sharply downward. I was not able to observe a clear effect like this in the data so I left it out of this model.
The features
Ultimately, the features I used to estimate strike probability were:
- Normalized and handedness-corrected x position when crossing the plate
- Runs from -1.0 on the outside edge of the zone to 1.0 on the inside edge
- Normalized z position when crossing the plate
- Runs from -1.0 on the low edge of the zone to 1.0 on the high edge
- Whether there are two strikes and less than three balls
- Set to 1.0 if there are two strikes and less than three balls, 0.0 otherwise
- Whether there are tree balls and less than two strikes
- Set to 1.0 if there are three balls and less than two strikes, 0.0 otherwise
Here’s what the data processing code looks like if you’re curious. It uses PyBaseball and Polars.
PLATE_WIDTH_IN = 17
PLATE_HALF_WIDTH_FT = PLATE_WIDTH_IN / 2 / 24
balls_strikes = (
    pl.from_pandas(statcast(start_dt="2023-04-01", end_dt= "2024-04-01"))
    .filter(
        pl.col('description').is_in(['called_strike', 'ball'])
    )
    .select(
        pl.col("fielder_2").alias("catcher_id"),
        (pl.col("description") == "called_strike").cast(int).alias("strike"),
        "plate_x", # x location at plate in feet from center
        "plate_z", # z location at plate in feet from ground
        "sz_bot", # bottom of strike zone for batter in feet from ground
        "sz_top", # top of strike zone for batter in feet from ground
        (pl.col("sz_top") - pl.col("sz_bot")).alias("sz_height"),
        (pl.col("strikes") == 2).alias("two_strikes"),
        (pl.col("balls") == 3).alias("three_balls"),
        (1 - (2 * (pl.col("stand") == "L"))).alias("handedness_factor"), # -1 for lefties, 1 for righties
    )
    .with_columns(
        ((pl.col("plate_z") - pl.col("sz_bot")) / pl.col("sz_height") * 2 - 1).alias("plate_z_norm"), # plate_z from -1 to 1
        (pl.col("plate_x") / PLATE_HALF_WIDTH_FT).alias("plate_x_norm"), # plate_x from -1 to 1
        (pl.col("two_strikes") & ~pl.col("three_balls")).alias("two_strikes_and_not_three_balls"),
        (~pl.col("two_strikes") & pl.col("three_balls")).alias("three_balls_and_not_two_strikes"),
    )
    .drop_nulls()
)
K Nearest Neighbors
I used a method called K Nearest Neighbors(KNN) to establish the expected strike probability for each pitch. For each pitch, I look up the 25 most similar pitches. The set of similar pitches is called the “neighborhood” and (in this case) it’s determined based on distance when plotted on a graph. For example, the neighborhood might look like this for a pitch near the inside corner for a right handed hitter.
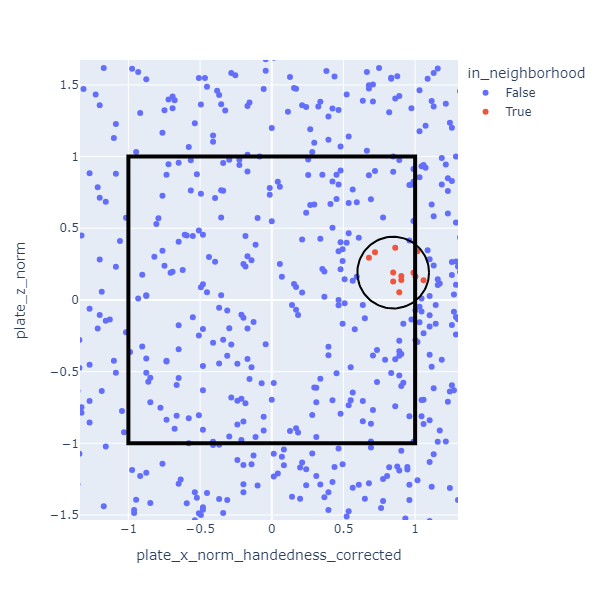
The expected strike probability is defined as the the fraction of pitches in the neighborhood that were called strikes. In the data I used, the neighborhoods are much smaller than the one depicted. There are so many pitches that the 25 nearest ones are close together.
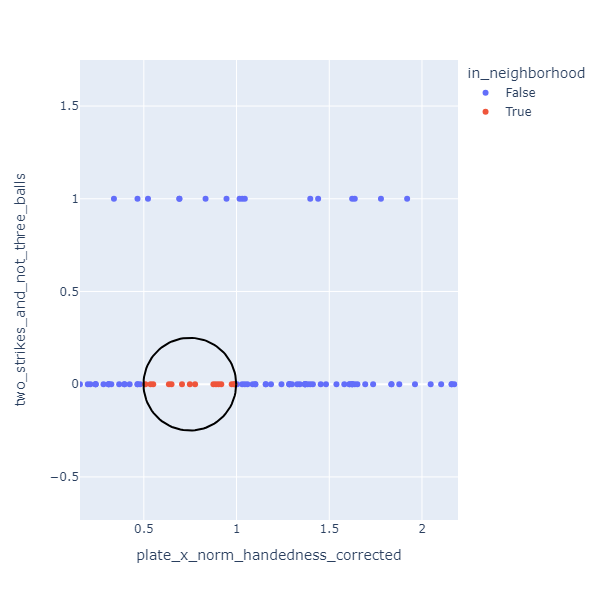
Two of the features I used (two strikes less than three balls, three balls less than two strikes) have values that are either 0 or 1. These have an interesting effect on the neighborhood calculation. Because of the relative scales involved, neighborhoods will almost always include only pitches with the same value for these discrete features. This is okay though.
Essentially I have three separate classifiers here: one for 0-2, 1-2, and 2-2 counts when umpires are more inclined to call a ball, one for 3-0 and 3-1 counts when umpires are more likely to call a strike, and one for all other counts.
Results
With this KNN method it’s easy to evaluate a catcher. For each catcher, look at the pitches they received. For each pitch find the neighborhood pitches and calculate the fraction that were called strikes. Add up these fractions to determine the number of expected strikes. Compare that sum to the total number of strike calls they got.
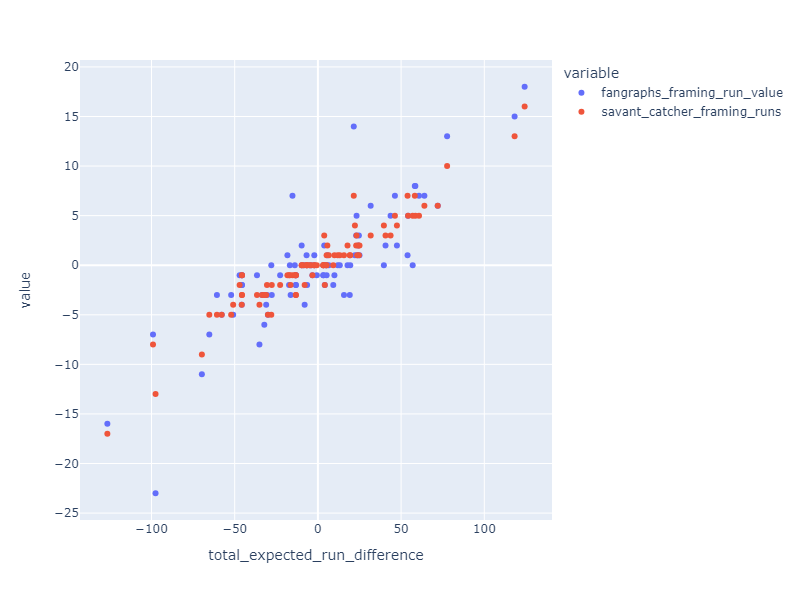
The resulting stat correlates well with Fangraphs and Baseball Savant catcher framing statistics.
Finally, here’s how the numbers come out for 2023:
| Name | Avg expected strike difference (per 100 pitches) |
Total expected strike difference |
|---|---|---|
| Francisco Álvarez | 1.52 | 125.72 |
| Patrick Bailey | 1.94 | 124.24 |
| Austin Hedges | 2.33 | 118.20 |
| Jonah Heim | 0.83 | 77.64 |
| Jose Trevino | 1.87 | 72.00 |
| Víctor Caratini | 1.61 | 68.20 |
| Cal Raleigh | 0.77 | 64.00 |
| Jake Rogers | 0.87 | 60.76 |
| Alejandro Kirk | 0.83 | 58.56 |
| William Contreras | 0.70 | 58.24 |
| Adley Rutschman | 0.70 | 56.96 |
| Seby Zavala | 1.22 | 54.20 |
| Kyle Higashioka | 0.99 | 53.88 |
| Jason Delay | 1.11 | 47.48 |
| Cam Gallagher | 1.36 | 46.28 |
| Christian Vázquez | 0.69 | 43.68 |
| Tucker Barnhart | 1.54 | 40.64 |
| Yasmani Grandal | 0.66 | 39.64 |
| Austin Wynns | 0.95 | 31.72 |
| Joey Bart | 1.25 | 25.00 |
| Freddy Fermin | 0.58 | 24.64 |
| Miguel Amaya | 0.97 | 24.28 |
| Ben Rortvedt | 1.15 | 23.64 |
| Nick Fortes | 0.34 | 23.24 |
| Gary Sánchez | 0.50 | 23.00 |
| Travis D'arnaud | 0.47 | 22.24 |
| Sean Murphy | 0.30 | 21.56 |
| Brian Serven | 2.54 | 19.44 |
| Blake Sabol | 0.59 | 19.16 |
| René Pinto | 0.73 | 17.80 |
| Austin Barnes | 0.43 | 15.68 |
| Tomás Nido | 0.93 | 13.16 |
| Tyler Heineman | 1.18 | 11.92 |
| Mike Zunino | 0.38 | 9.92 |
| Ali Sánchez | 6.04 | 9.48 |
| Austin Wells | 0.51 | 9.24 |
| Reese Mcguire | 0.17 | 6.56 |
| Danny Jansen | 0.12 | 5.68 |
| Roberto Pérez | 2.07 | 5.28 |
| Omar Narváez | 0.16 | 5.24 |
| Alex Jackson | 2.65 | 5.04 |
| Dillon Dingler | 3.70 | 4.88 |
| Logan Porter | 0.71 | 4.84 |
| Will Smith | 0.05 | 4.16 |
| Bo Naylor | 0.08 | 3.80 |
| Sandy León | 0.42 | 3.32 |
| Anthony Bemboom | 0.76 | 3.28 |
| Mj Melendez | 0.55 | 3.20 |
| Caleb Hamilton | 2.08 | 3.00 |
| Andrew Knapp | 8.67 | 2.60 |
| Grant Koch | 3.45 | 2.52 |
| Payton Henry | 1.72 | 2.20 |
| Israel Pineda | 8.17 | 1.88 |
| Carlos Narvaez | 7.27 | 1.60 |
| Tres Barrera | 2.47 | 1.48 |
| Henry Davis | 0.09 | 0.48 |
| Austin Allen | 4.36 | 0.48 |
| Chris Okey | 0.69 | 0.40 |
| Zack Collins | 0.28 | 0.36 |
| Rob Brantly | 1.27 | 0.28 |
| Mickey Gasper | 1.41 | 0.24 |
| Dom Nuñez | 2.67 | 0.16 |
| David Bañuelos | -0.00 | -0.00 |
| Hunter Goodman | -0.52 | -0.12 |
| Joe Hudson | -0.61 | -0.20 |
| Chuckie Robinson | -0.93 | -0.28 |
| Mark Kolozsvary | -0.34 | -0.48 |
| Aramis Garcia | -0.60 | -0.52 |
| Jorge Alfaro | -0.16 | -0.64 |
| Tyler Cropley | -0.47 | -0.88 |
| Pedro Pagés | -1.40 | -1.12 |
| Manny Piña | -1.06 | -1.32 |
| Jhonny Pereda | -9.20 | -1.84 |
| César Salazar | -0.46 | -2.16 |
| Mitch Garver | -0.12 | -2.20 |
| Kyle Mccann | -1.28 | -2.36 |
| Drew Romo | -10.21 | -2.96 |
| Korey Lee | -0.17 | -3.28 |
| James Mccann | -0.10 | -4.08 |
| Brian O'keefe | -1.11 | -4.84 |
| Michael Pérez | -3.89 | -5.64 |
| Chad Wallach | -0.19 | -6.48 |
| Drew Millas | -0.94 | -6.68 |
| Chadwick Tromp | -1.52 | -6.80 |
| Eric Haase | -0.20 | -7.96 |
| Luis Torrens | -5.09 | -8.24 |
| Meibrys Viloria | -4.40 | -8.44 |
| Iván Herrera | -0.77 | -8.52 |
| Sam Huff | -3.14 | -9.68 |
| Endy Rodríguez | -0.28 | -9.76 |
| Carlos Pérez | -1.34 | -13.24 |
| Curt Casali | -0.66 | -13.88 |
| Gabriel Moreno | -0.18 | -15.28 |
| Luis Campusano | -0.50 | -16.40 |
| Matt Thaiss | -0.33 | -16.84 |
| Tyler Soderstrom | -1.57 | -17.32 |
| Carson Kelly | -0.51 | -18.32 |
| Christian Bethancourt | -0.34 | -22.68 |
| Brett Sullivan | -1.48 | -27.72 |
| Yainer Diaz | -0.70 | -28.00 |
| Jacob Stallings | -0.56 | -30.04 |
| David Fry | -3.01 | -30.60 |
| Austin Nola | -1.00 | -31.08 |
| Tom Murphy | -1.17 | -32.20 |
| Garrett Stubbs | -1.31 | -33.56 |
| Ryan Jeffers | -0.63 | -35.12 |
| Salvador Pérez | -0.55 | -35.52 |
| Yan Gomes | -0.52 | -36.60 |
| José Herrera | -1.35 | -38.56 |
| Carlos Pérez | -1.82 | -45.64 |
| Francisco Mejía | -1.47 | -45.76 |
| Luke Maile | -1.05 | -47.04 |
| Andrew Knizner | -1.01 | -50.92 |
| Willson Contreras | -0.75 | -52.12 |
| Riley Adams | -1.84 | -57.80 |
| Connor Wong | -0.75 | -60.68 |
| Logan O'hoppe | -1.57 | -65.24 |
| Tyler Stephenson | -1.13 | -69.72 |
| Elías Díaz | -1.07 | -96.52 |
| Keibert Ruiz | -1.06 | -97.56 |
| Shea Langeliers | -1.03 | -99.08 |
| Martín Maldonado | -1.41 | -126.52 |
| J. T. Realmuto | -1.18 | -126.96 |